Quarterly Market Report
2022 in review: The stock and bond markets
Here's a look at what happened in the financial markets in 2022.
Stocks
2022 was a reminder that investing is a game of long-term focus, patience, and discipline, with the stock and bond markets down after phenomenally strong years in 2020 and 2021.
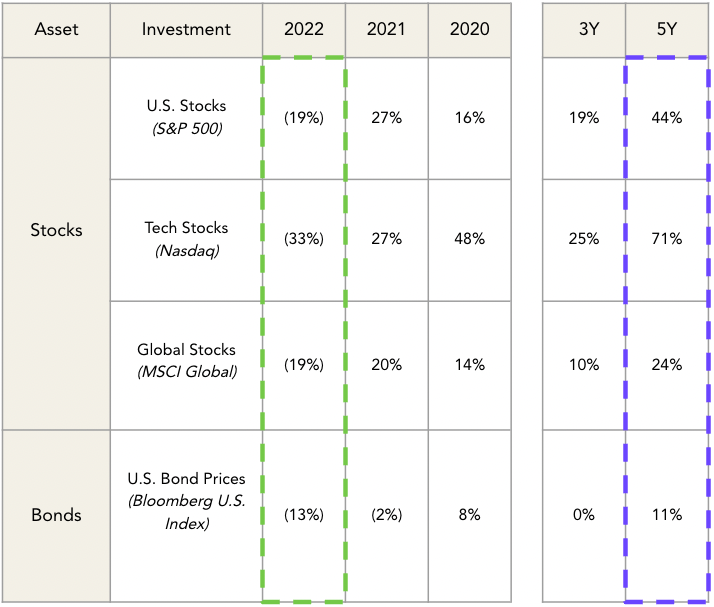
Despite the pullback for stocks and bonds in 2022, the stock market’s three-year and five-year returns are still very much at, or even better than, their long-term averages.
Last January, the S&P 500 Index hit an all-time high, but soon after, stock prices started to pull back. By June, stocks entered bear market territory. A bear market is when stocks drop by 20% from a prior high. This was the first bear market we've seen since March 2020, and only the second bear market since July 2008.
Bonds
Bonds had a very unusual year, declining along with stocks.
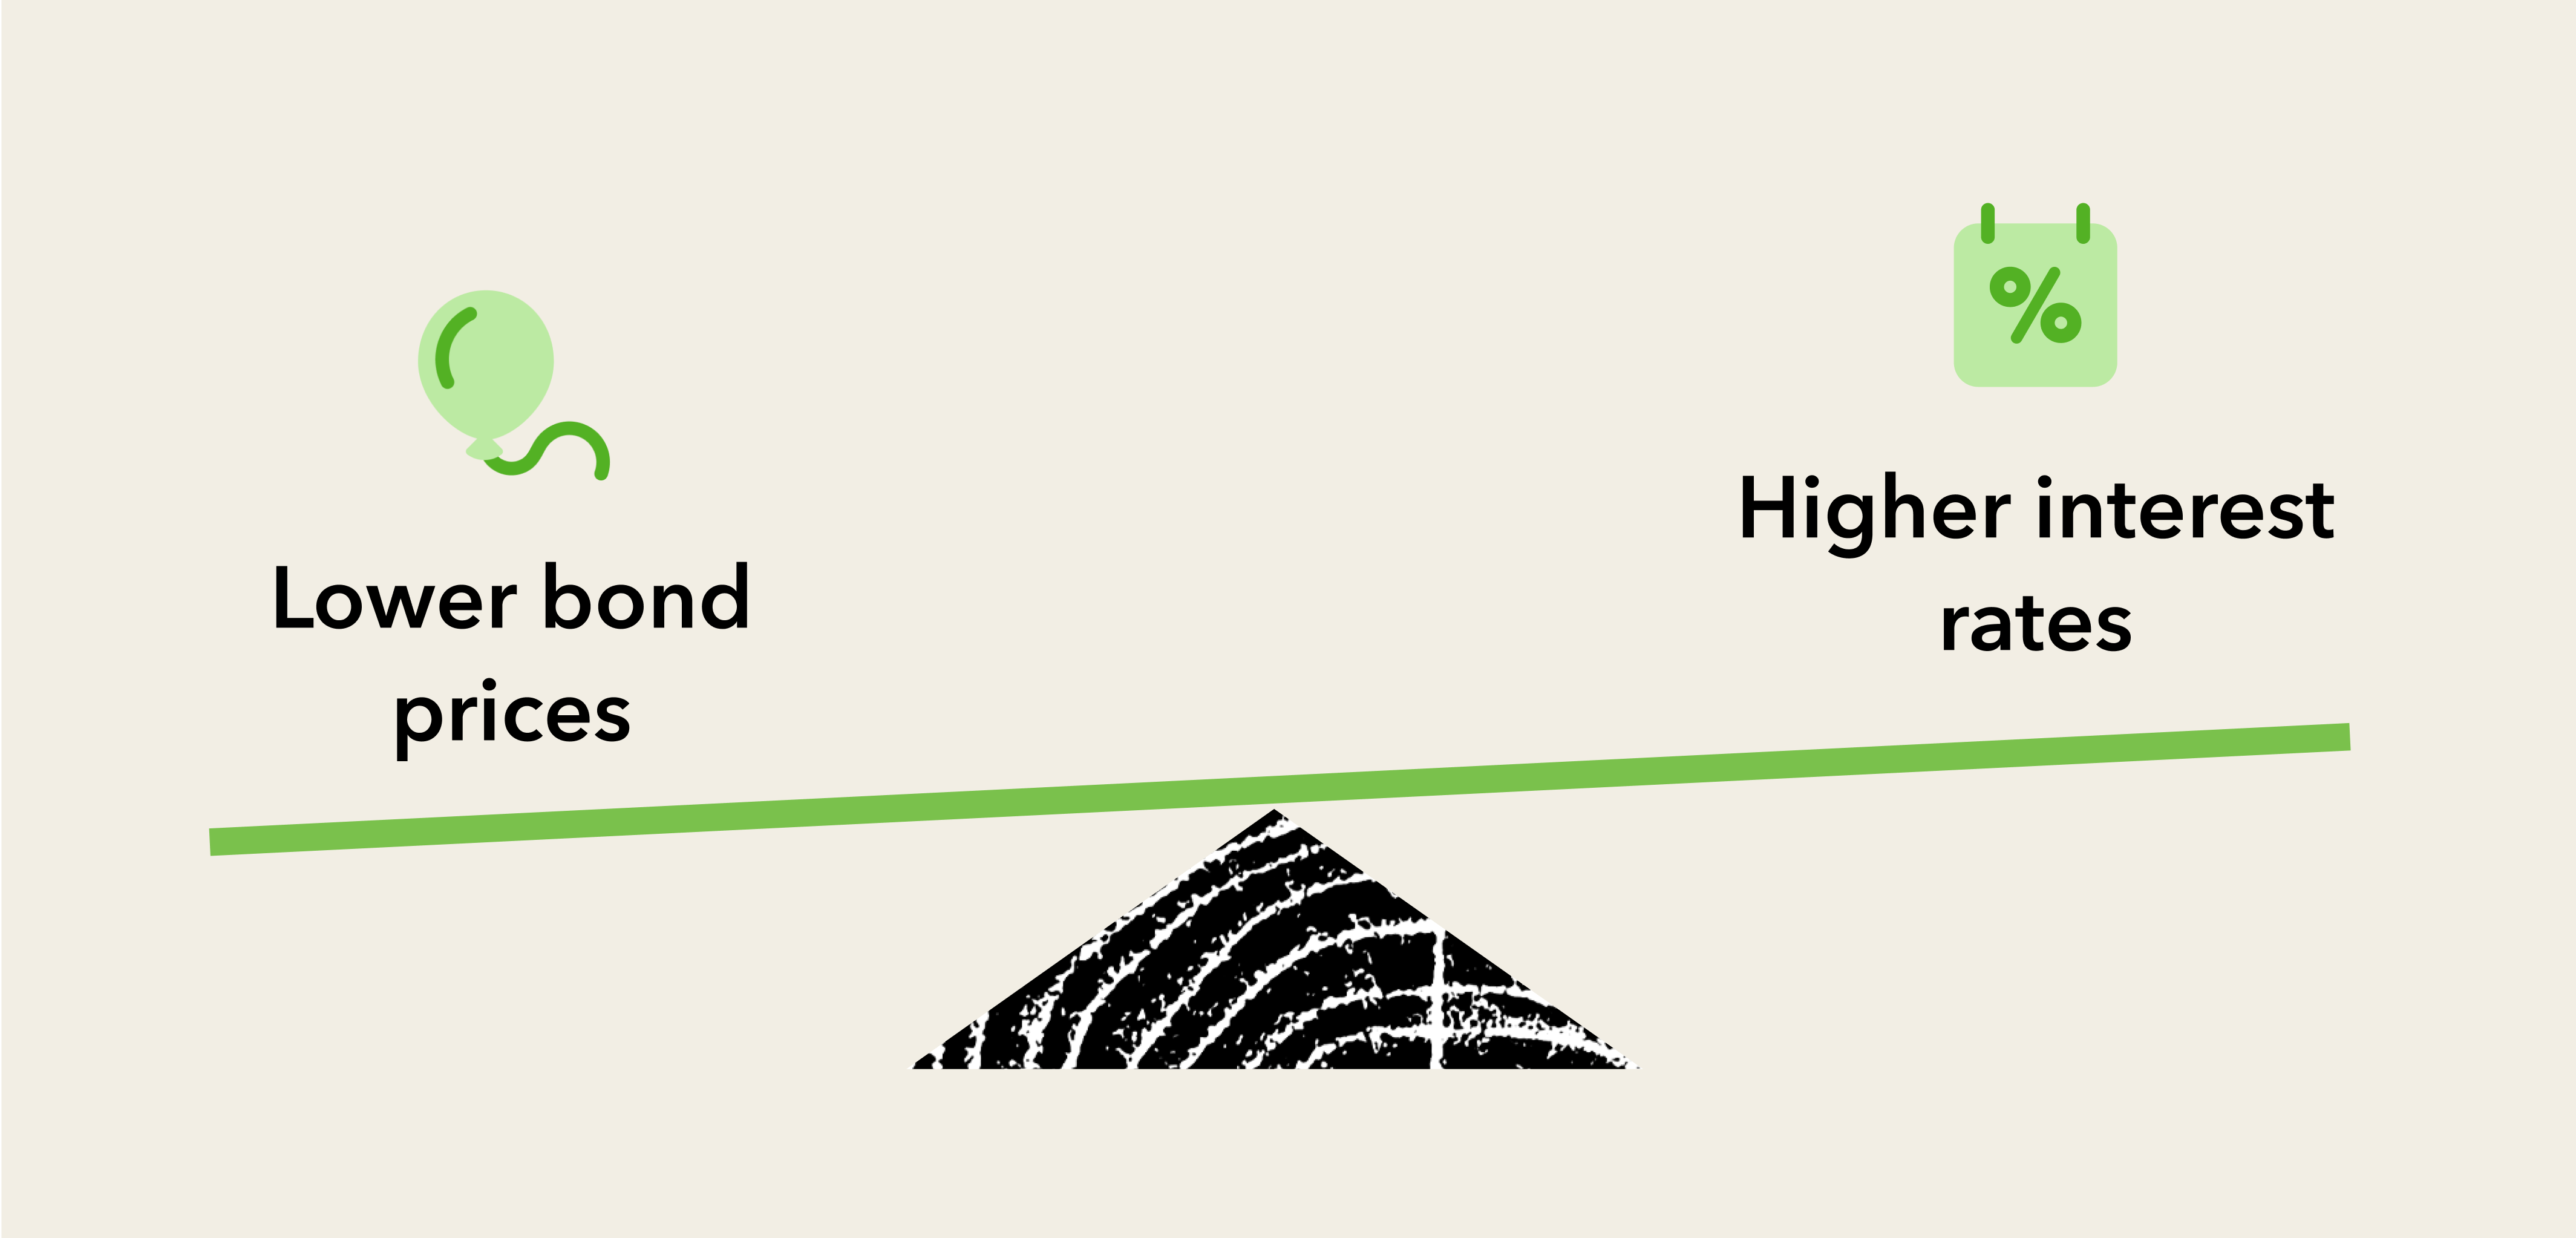
Bonds are often considered to be a safer investment than stocks — so what happened this year? As a general rule of thumb, bond prices decline when interest rates increase, as they did in 2022.
We saw the flip side occur in prior downturns, like the housing crisis in 2008 or the tech bubble in 2002. In both of those years, interest rates went down and bonds increased in value, even though stocks declined.
There's a silver lining to the bond market movement, though. New investments in bonds now pay more in interest income than they have for the last 15 years. The increase in bond market interest rates means a significant boost in potential passive income for diversified bond investors.
With interest rates much higher now than they’ve been in years, investors have more reason to put money in bonds. It’s reasonable to assume part of the pressure in stocks this past year was driven by a rotation of money out of stocks and into bonds.
2022 in review: What factors influenced stocks and bonds?
So what drove this movement in the financial markets? Let's take a look.
Inflation
Inflation is when prices for things go up over time. This means the same amount of money you have today might not be able to buy as much in the future.
What causes this?
In this case, when the economy paused during the COVID-19 pandemic, Congress and the Federal Reserve stepped in to help businesses and consumers by “printing money” to stabilize and stimulate the economy. This meant a massive amount of extra money was distributed, increasing the total amount of dollars in the economy by 25%.
But there was virtually no increase in the amount of things this new money could be used to purchase. With lots of new money available to buy things and few extra things to buy, prices rose for many goods and services.
Imagine an auction where people bid to purchase different collectibles. All of a sudden, the bidders have 25% more money but the auction house has the same number of things to sell (or even fewer things to sell). The result? The average selling price of those remaining items tend to increase.
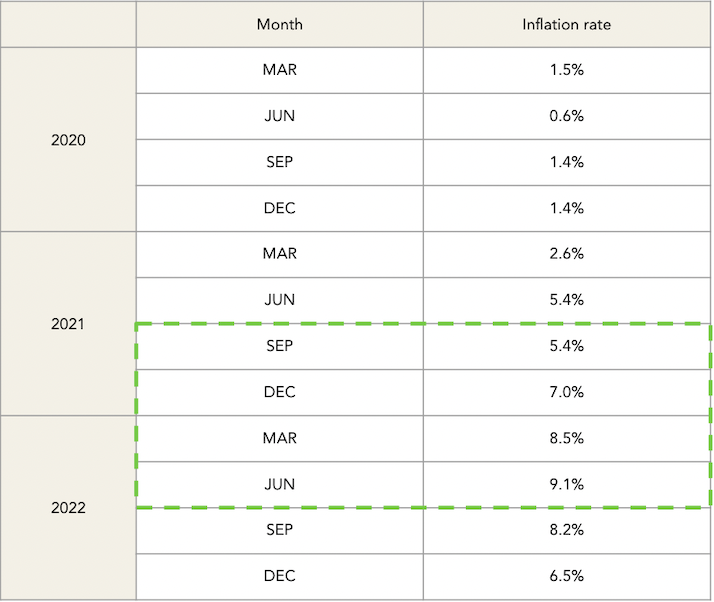
This was the beginning of the inflationary cycle. But the inflationary pressures take time to build, as you can see in the table below. Even though the official government data showed large increases in goods and services during 2021, the extreme acceleration of inflation wasn’t apparent until later in the year and into the first half of 2022.
Interest rates
Interest is the price of borrowing money. When you borrow money from a bank, you have to pay back the money you borrowed (the principal) plus some extra (interest).
Interest rates are influenced by the Fed, which may increase or decrease them periodically in order to control the economy's growth. When interest rates are low, companies and people can borrow money easily to buy things, which helps the economy grow quickly. Conversely, when interest rates are high, less money is borrowed, which means less spending. Back to our auction house analogy from before: if there are fewer bidders on goods and services then prices can start to come back down, lowering inflation.
Starting in the first half of 2022, the Fed decided to increase interest rates in a bid to combat inflation. Rates rose dramatically, from 0.25% in March to 4.5% by December.
What does this mean in practical terms? The rise in interest rates has affected everything from credit card APRs to mortgage rates. For someone wanting to borrow $1,000, for example, the difference between these nine months was an interest payment of $2.5 versus $45 per year. A jump in mortgage rates has in turn affected home prices as the interest portion of a mortgage payment rose meaningfully, causing the number of new homes being sold to fall over the last several months.
Additionally, since people tend to spend money on improvements after moving into a new home, the decrease in home sales has lowered spending on goods — influencing inflation to continue coming down.
Just as higher interest rates can lead to people spending less money, they do the same thing for businesses, too. Most companies use debt to finance their operations and growth. Even Apple, the highest valued company in the world, has debt ($100 billion of it). As the cost of taking on debt rises, companies will be less likely to take on additional debt to expand their business. This means less investment in new facilities and new research, and possibly a slowdown in hiring. In the middle of 2022, expenditures by businesses declined by roughly 10% year-over-year, largely due to the broader slowdown in the economy from rising interest rates.
The economy
If you study history, the state of today’s economy — with inflation, increasing interest rates, as well as the movements of the financial markets — isn't unique. The big question is, will the landing be a hard or soft one? That's financial jargon that essentially means, "can the Fed successfully slow the economy and cool down inflation without pushing the country into a recession?"
Here's some historical perspective. In the 1970s and early 1980s, interest rates were increased very quickly to combat inflation, causing the economy to slow down into a recession — a "hard landing." In contrast, during the 1990s, interest rates were again increased to bring down inflation, but the economy slowed without going into a recession — a "soft landing."
Despite what you may hear in the news, and even with the rise in interest rates, the economy in 2022 was generally resilient. The labor market remained strong, as job openings stayed at the highest levels in at least 20 years, and unemployment declined to a 50 year low of 3.5%. Consumer spending remained robust, increasing about 2% throughout the first 9 months of the year.
It takes time for the changes in interest rates to affect the economy, but the evidence from 2022 suggests that we have a better chance of a soft landing than a hard one.
Investors will be looking to see if the tide changes in 2023.
2023: A look forward
So what's coming up in 2023? Here's what to look out for.
Inflation
Inflation peaked last year in June at 9.1% and fell for the following five straight months. In fact, many commodities (like gas and food) that drive inflation actually ended 2022 at lower prices than where they started the year. Most importantly, national gas prices, which rose 50% from January to June last year, have pulled back materially since then.
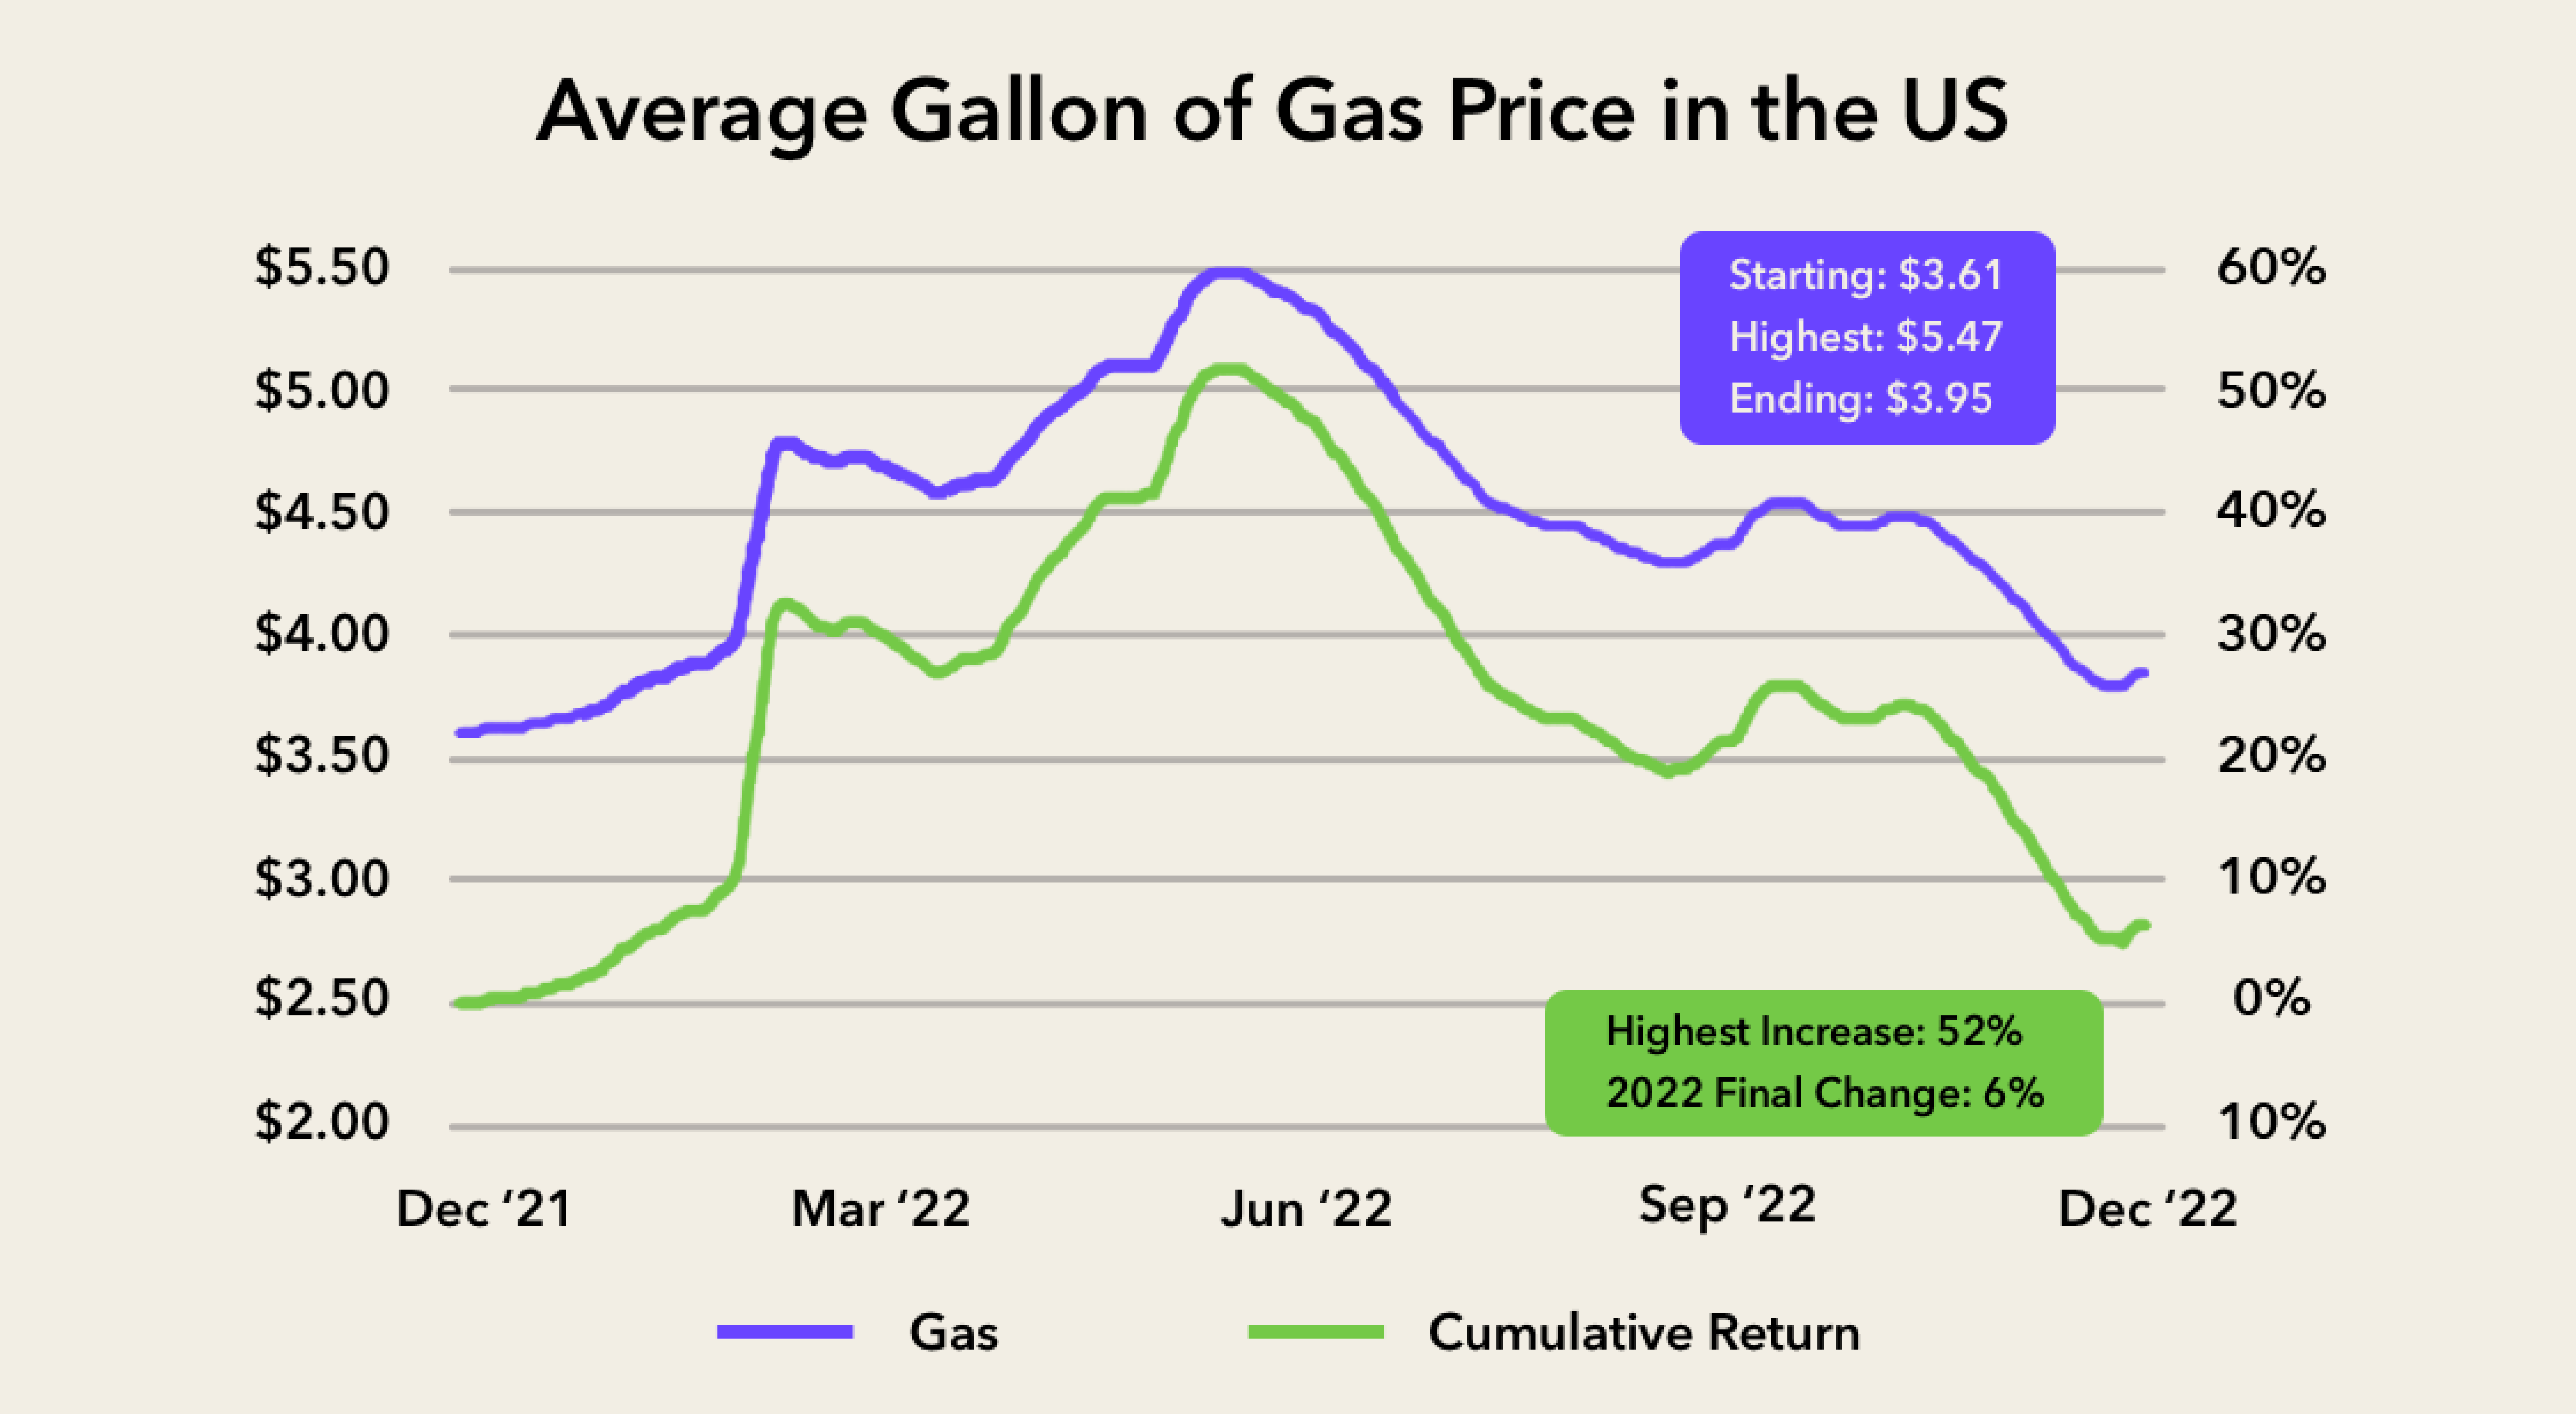
The cooling trend in inflation seems likely to continue for two important reasons:
-
Inflation measurements are lagging indicators, meaning prices have already come down that haven't yet been included in the government data. Rent and mortgages are the biggest component of measuring inflation and those numbers are essentially six months delayed.
-
Inflation is the increase in prices over a period of time. With the pullback in commodity and gas prices, if prices simply remain stable from here for the first five months of 2023, then the inflation rate by May would be only 1.9%.
Will the Fed pivot?
Interest rate hikes were fast and furious in 2022. It's known as a "hiking cycle" when the Fed increases rates multiple times in a year. Investors are now looking out for a pivot from the Fed, or a stopping point in that cycle.
Fed pivots have been historically important for the stock market. The last time the Fed aggressively hiked rates to combat high inflation was in the early 1980s. Back then, a 21-month-long bear market saw the market decline 27%. The Fed pivoted, and from the low point, it took just 83 days to recover and reach new all-time highs.
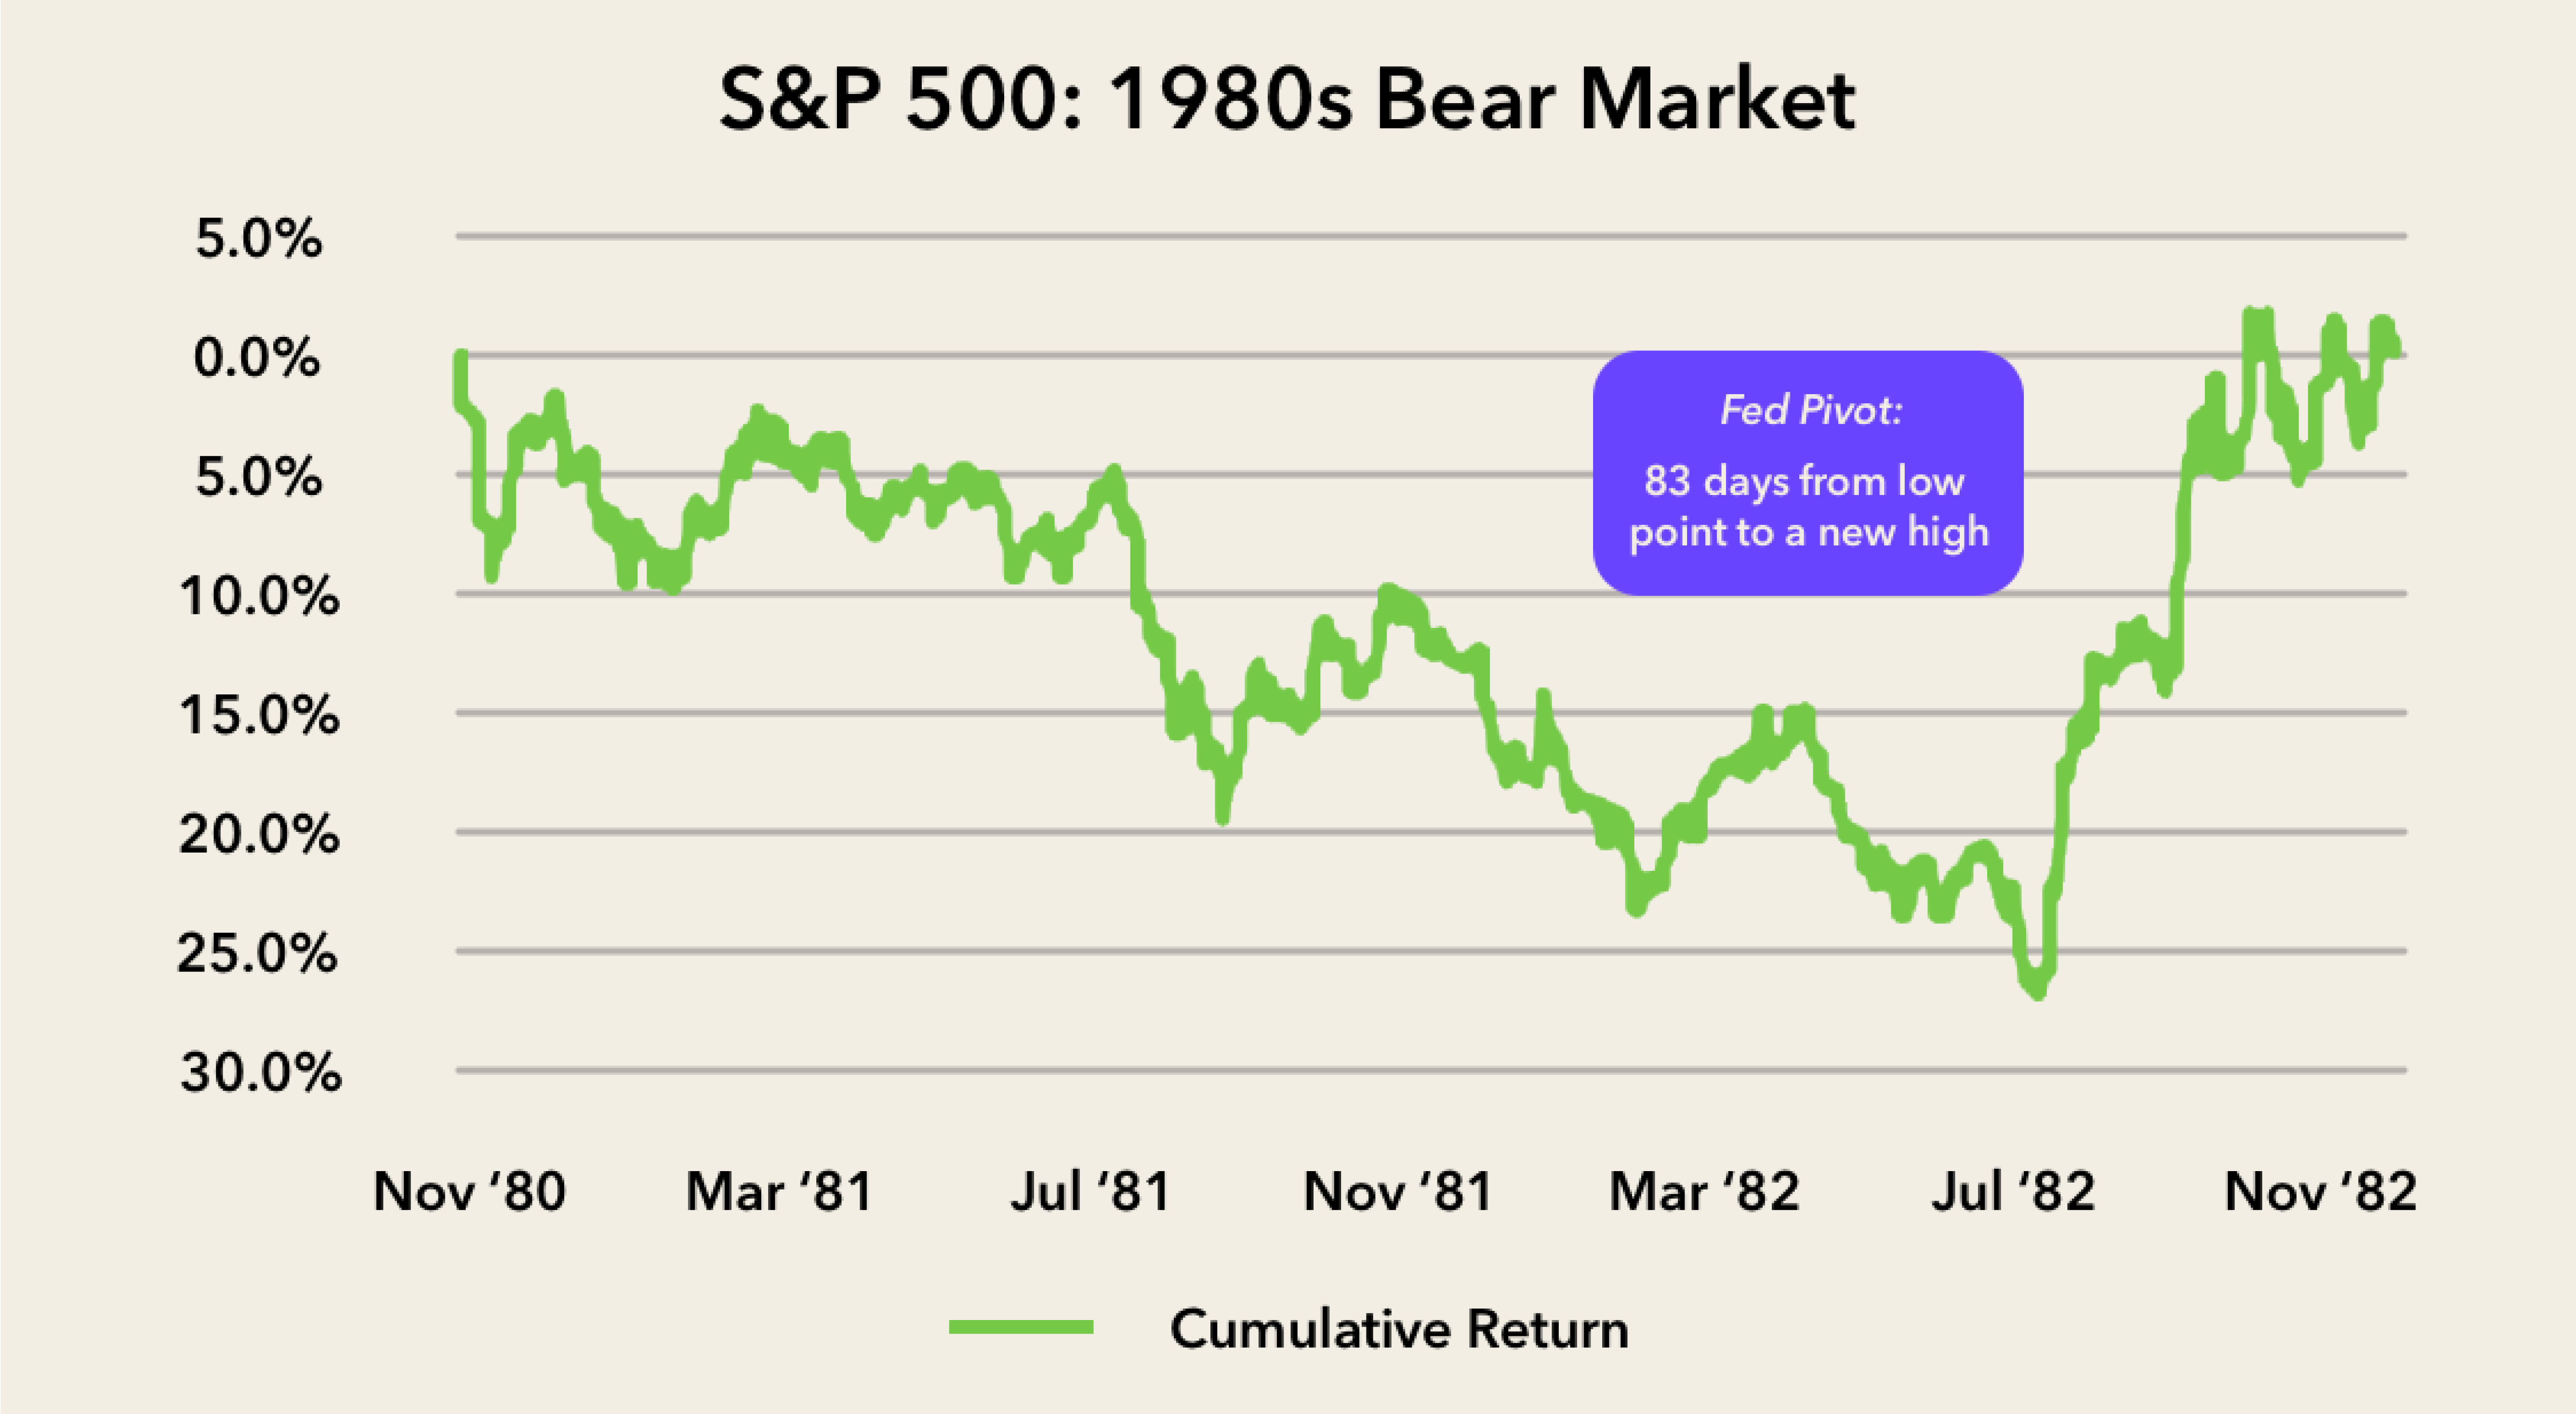
In 2023, the majority of rises are thought to have already occurred. The expectation in the market is for rates to rise only another 0.5% from here. This means the decline in bond prices in 2022 is much less likely to repeat in 2023.
Taking a step back
It's always important to have a good understanding of the markets, but after a year like 2022, it's even more critical to take a step back. Rather than focusing on the markets in the short-term, look at the opportunities for the long-term.
Coming into 2022, using the S&P 500 index as a gauge, the general U.S. market was up 90% from 2019 to 2021. That’s an average annual return of 24%, which is more than double the 100-year average annual return for the S&P 500.
After last year's 20% decline, the market is still up 19% over the last three years, and 44% over the last five years — not too shabby!
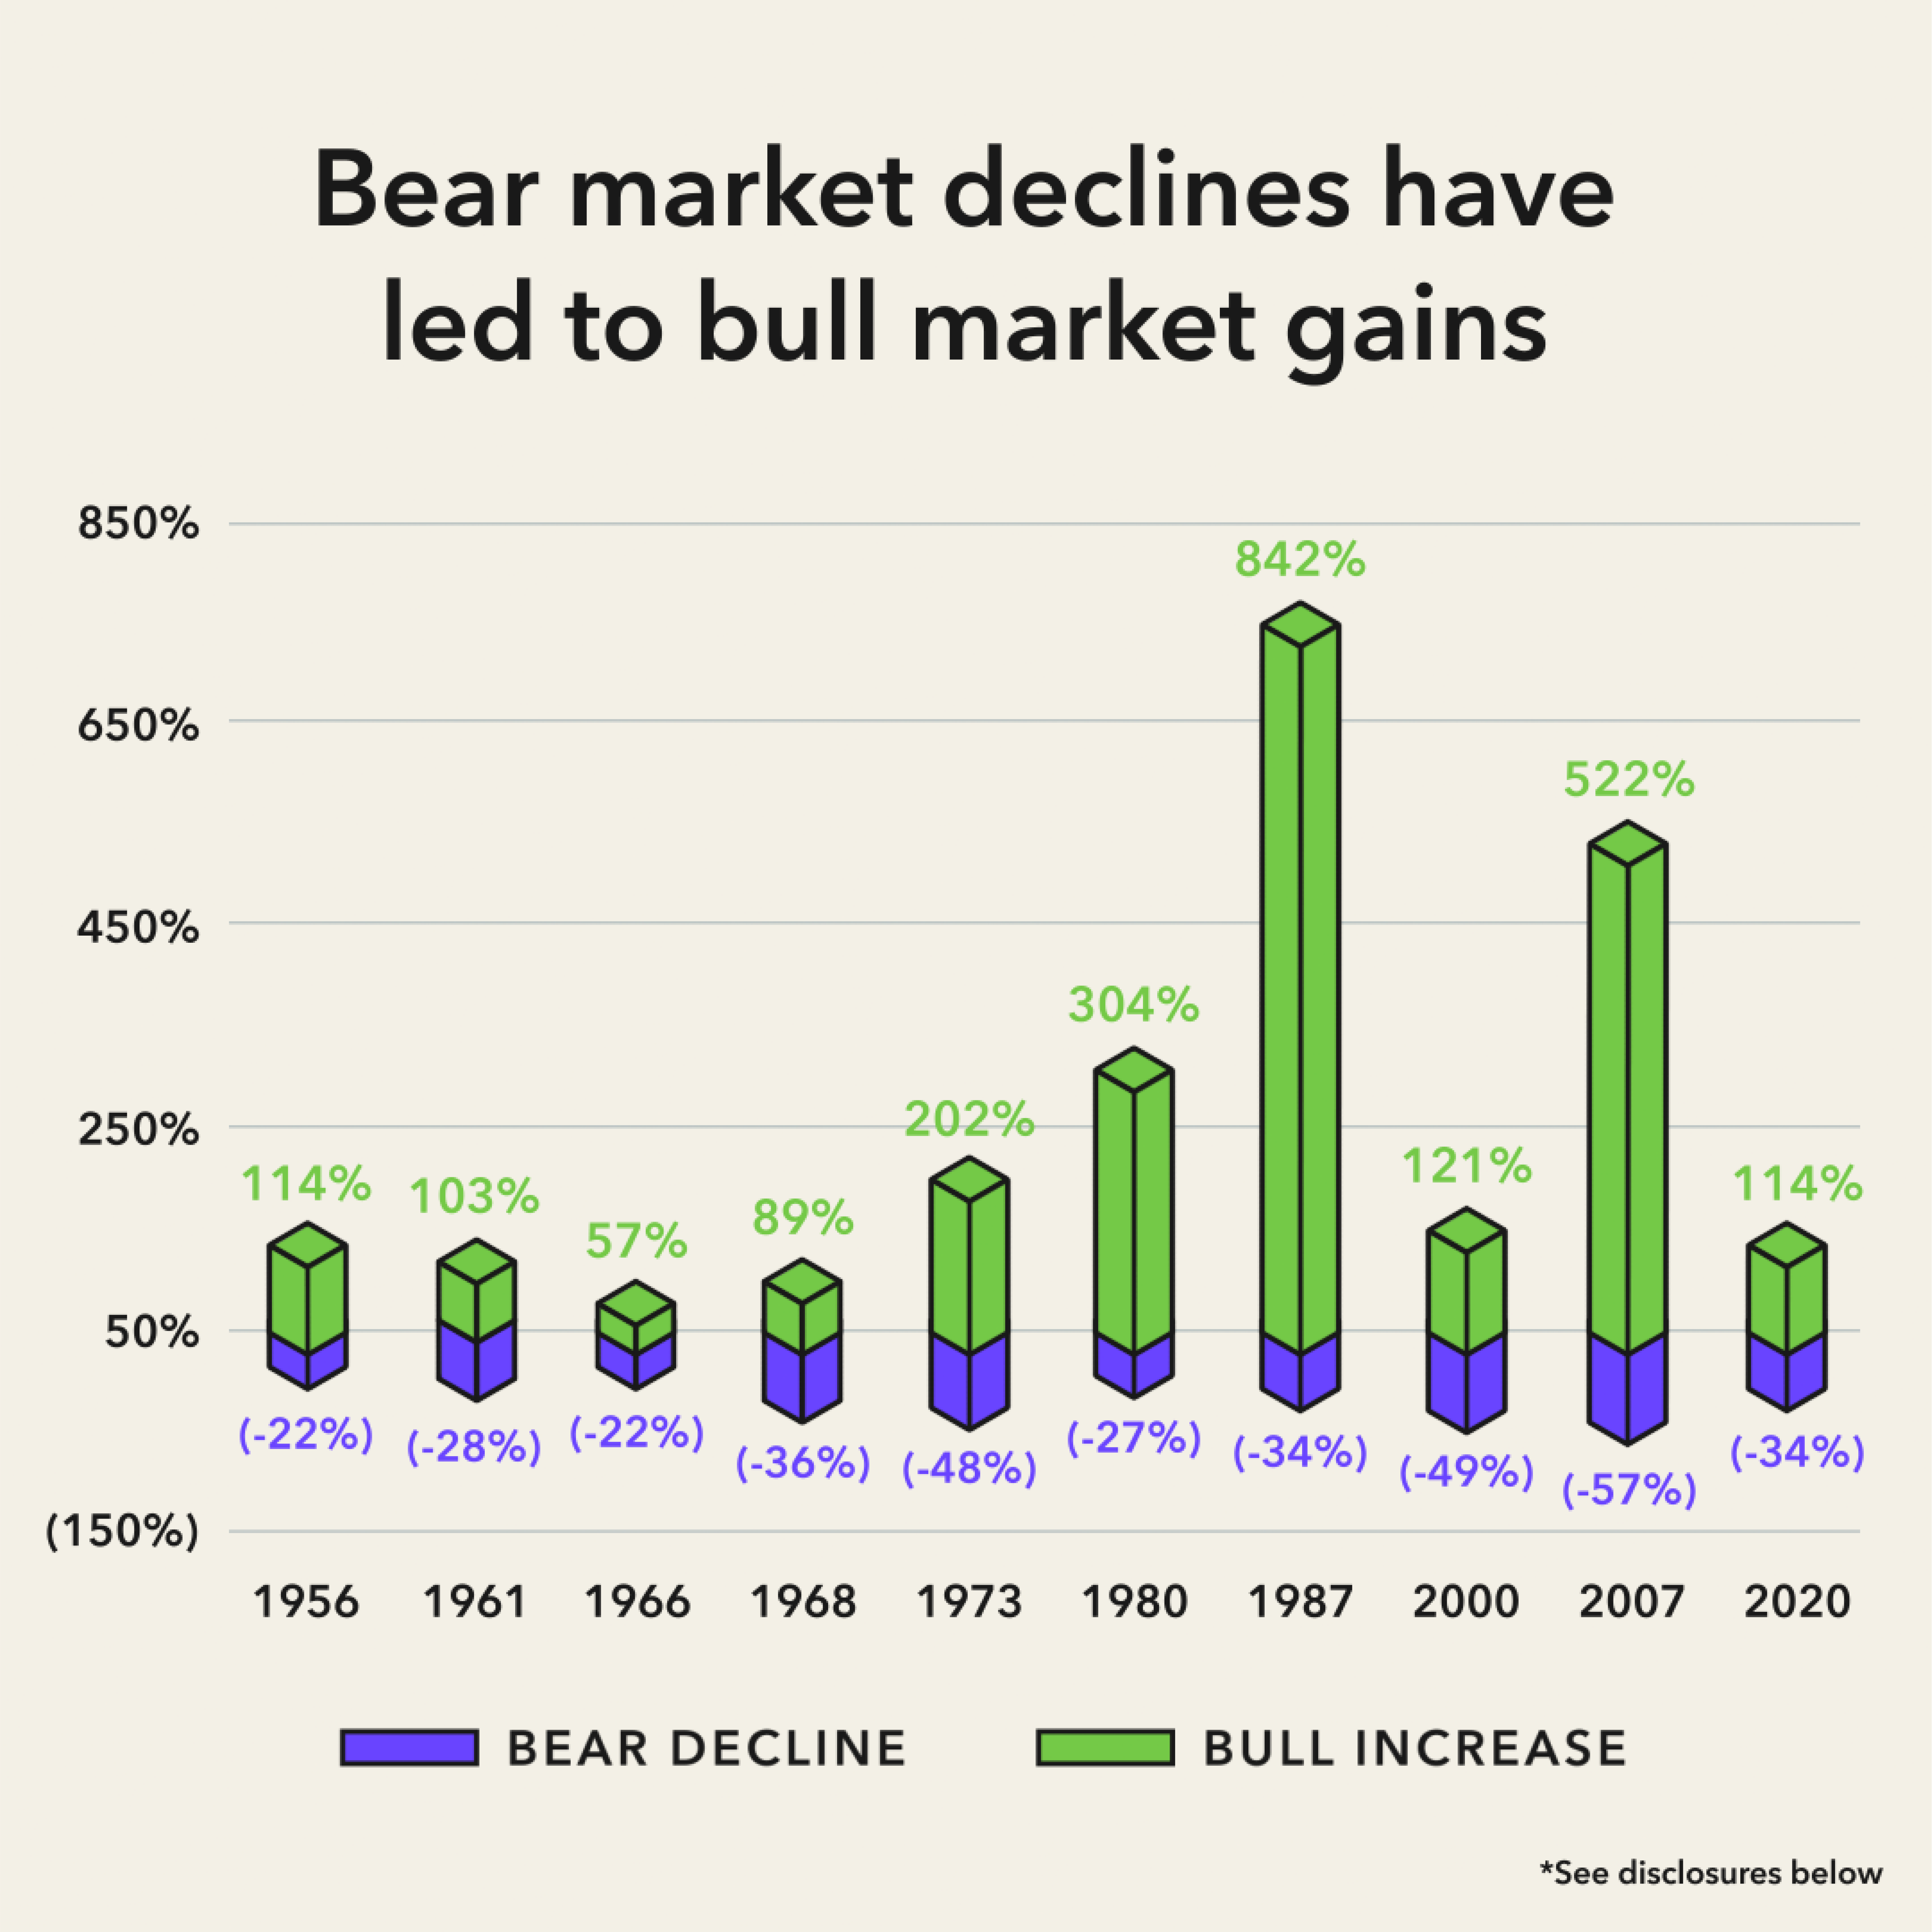
Rates and inflation rise and fall. Stocks have had many years worse than 2022, and many bear markets have dropped more than 25%. And most of all, it's important to remember that historically, every instance of a market downturn has ended with markets recovering to make new highs.
Past performance doesn't guarantee future results, but bear markets don’t look as scary when compared to the bull markets that came afterwards.
In closing
Remember that long-term investing requires patience and discipline, but can also lead to great rewards. As the legendary investor Peter Lynch once said, "Far more money has been lost by investors preparing for corrections, or trying to anticipate corrections, than has been lost in corrections themselves."
Said another way, time in the market is often a better bet than timing the market. Remember, market downturns historically don’t last long: since 1950, the S&P 500 has finished the year higher than it started 78% of the time.
For those attending tomorrow’s live Q&A session, we’re looking forward to speaking with you then. Keep an eye out for our next quarterly financial markets update in April.
Important Information
The opinions, statements and forecasts presented are for general information only and not intended as investment advice or recommendations. They do not account for specific investment objectives, tax or financial conditions. There is no assurance that the strategies discussed are suitable for all investors or that they will be successful.
Any forward-looking statements including economic forecasts may not develop as predicted and are subject to change based on future market and other conditions. Please consult your financial professional prior to investing.
References to markets, asset classes, and sectors are generally regarding the corresponding market index. Index performance is not indicative of the performance of any investment and does not reflect fees, expenses, or sales charges. You cannot invest directly into an index. All performance referenced is historical and there is no guarantee of future results.
Investment involves risk, including the loss of principal. Carefully consider your financial situation, including investment objective, time horizon, risk tolerance, and fees prior to making any investment decisions. Investment advisory services provided by Acorns Advisers, LLC SEC Registered Investment Adviser. Brokerage services provided to Acorns Advisers, LLC by Acorns Securities, LLC. Member FINRA/SIPC. For more information visit Acorns.com.
Definitions
S&P 500 Index is an unmanaged composite of 500 large capitalization companies. This index is widely used by professional investors as a performance benchmark for large-cap stocks.
NASDAQ Index: an index of more than 3,000 stocks listed on the Nasdaq exchange that includes the world’s foremost
Barclays Capital U.S. Aggregate Bond Index covers the USD-denominated, investment-grade, fixed-rate, taxable bond market of SEC-registered securities. The index includes bonds from the Treasury, Government-Related, Corporate, MBS (agency fixed-rate and hybrid ARM pass-throughs), ABS, and CMBS sectors.
MSCI world index is a broad global equity index that represents large and mid-cap equity performance across 23 developed markets countries. It covers approximately 85% of the free float-adjusted market capitalization in each country and MSCI world index does not offer exposure to emerging markets.
Cumulative Return: The aggregate amount that an investment has gained or lost over time, independent of the period of time involved.


